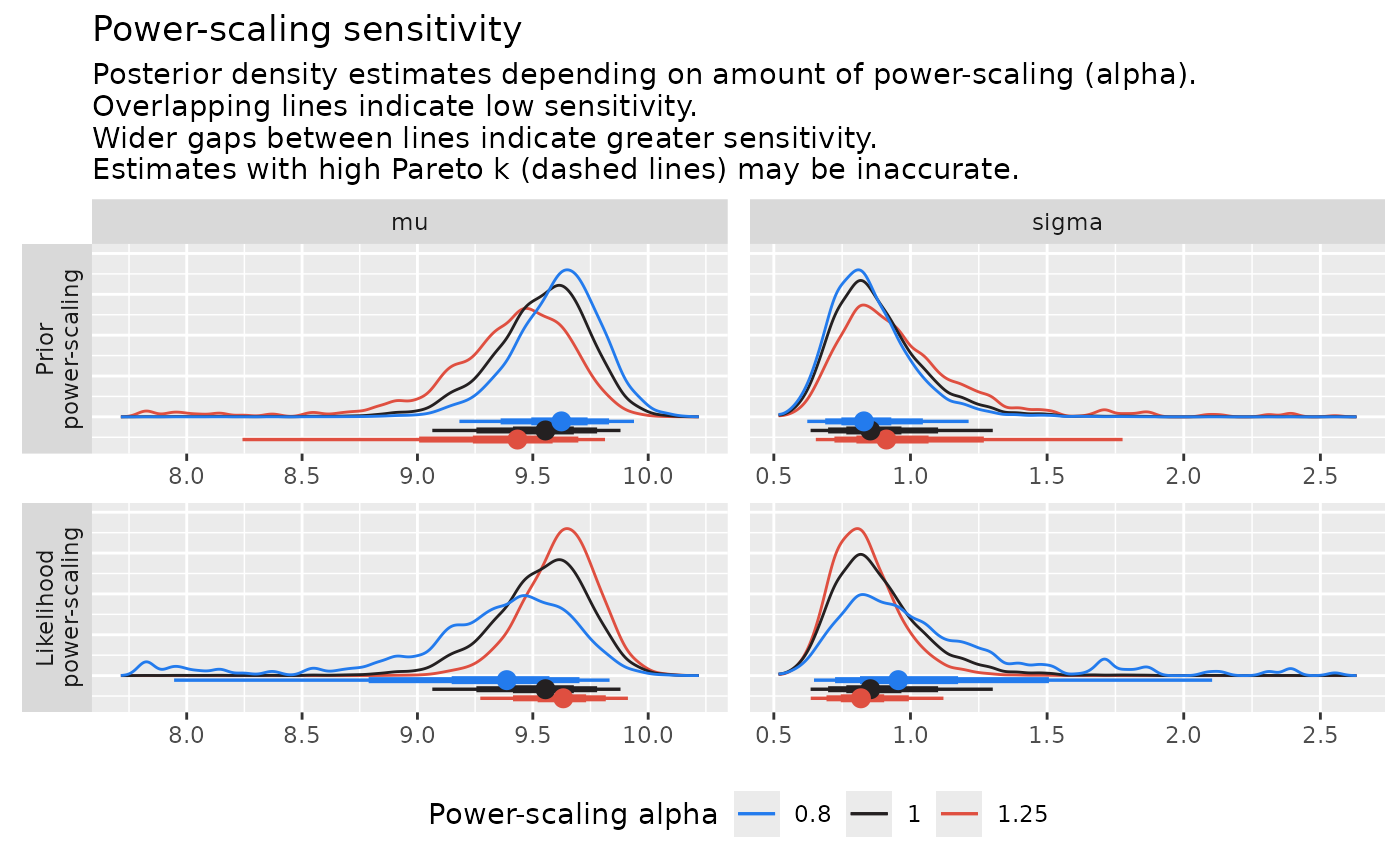
Various diagnostic plots for power-scaling sensitivity. See Plot Descriptions below for details.
Usage
powerscale_plot_dens(x, ...)

powerscale_plot_ecdf(x, ...)

# S3 method for class 'powerscaled_sequence'
powerscale_plot_ecdf(
  x,
  variable = NULL,
  variables = NULL,
  resample = FALSE,
  length = 3,
  facet_rows = "component",
  help_text = getOption("priorsense.plot_help_text", TRUE),
  colors = NULL,
  variables_per_page = getOption("priorsense.plot_variables_per_page", 6),
  ...
)

powerscale_plot_quantities(x, ...)

# S3 method for class 'powerscaled_sequence'
powerscale_plot_quantities(
  x,
  variable = NULL,
  variables = NULL,
  quantity = c("mean", "sd"),
  div_measure = "cjs_dist",
  resample = FALSE,
  measure_args = NULL,
  mcse = TRUE,
  quantity_args = NULL,
  help_text = getOption("priorsense.plot_help_text", TRUE),
  colors = NULL,
  variables_per_page = getOption("priorsense.plot_variables_per_page", 6),
  ...
)

# S3 method for class 'powerscaled_sequence'
plot(x, type = c("dens", "ecdf", "quantities"), ...)
Arguments
- x
An object of class
powerscaled_sequenceor an object for whichpowerscale_sequencewill first be run on.- ...
Arguments passed to
powerscale_sequenceifxis not of classpowerscaled_sequence.- variable
A character vector of variable names. If
NULL(the default) all variables will be plotted.- variables
Alias of
variable.- resample
Logical; Indicate whether or not draws should be resampled based on calculated importance weights.
- length
Numeric specifying how many alpha values should be used. Ignored of the object is of class
powerscaled_sequence.- facet_rows
Character defining the rows of the plot facets, either "variable" or "component". Default is "variable".
- help_text
Logical indicating whether title and subtitle with explanatory description should be included in the plot. Default is TRUE. Can be set via option "priorsense.show_help_text".
- colors
Character vector of colors to be used for plots. Either length 3 for
powerscale_plot_ecdfandpowerscale_plot_denswith order lowest, base, highest; or length 2 forpowerscale_plot_quantitieswith order low Pareto k, high Pareto k. IfNULLthe defaults will be used.- variables_per_page
Number specifying the maximum number of variables to show on each page of the plot. Default is 6. If
NULLorInf, all variables will be plotted on the same page.- quantity
A character vector specifying one or several quantities to plot. Options are "mean", "median", "sd", "mad", "quantile".
- div_measure
Character (case sensitive) specifying the divergence measure to use. The following methods are implemented:
"cjs_dist": Cumulative Jensen-Shannon distance. Default method. See functioncjs_distfor more details."js_dist": Jensen-Shannon distance."js_div": Jensen-Shannon divergence."hellinger_dist": Hellinger distance."kl_dist": Kullback-Leibler distance."kl_div": Kullback-Leibler divergence."ks_dist": Kolmogorov-Smirnov distance."hellinger_dist": Hellinger distance."ws_dist": Wassterstein distance (passmeasure_args = list(p = N)) for a different order, where N is the order.
- measure_args
Named list of further arguments passed to divergence measure functions.
- mcse
Boolean; If TRUE will plot +/- 2 * Monte Carlo standard error of the base quantity on the quantities plot.
- quantity_args
Named list of further arguments passed to quantity functions. Passed as
.argsto[posterior::summarise_draws].- type
Character specifying type of plot, one of "dens", "ecdf",or "quantities".
Value
A ggplot object (or a priorsense_plot object which is a
list of ggplot objects if there is more than one page) that can
be further customized using the ggplot2 package.
Plot Descriptions
powerscale_plot_dens()Kernel density plot of power-scaled posterior draws with respect to power-scaling.
powerscale_plot_ecdf()Empirical cumulative distribution function plot of power-scaled posterior draws with respect to power-scaling.
powerscale_plot_quantities()Plot of posterior quantities with respect to power-scaling.
Examples
ex <- example_powerscale_model()

powerscale_plot_dens(ex$draws)